GIS (Geographic Information System) is a digital technology widely used in most industries and organisations to capture, analyse, and visualize spatial data for mapping and decision-making. This makes it a highly relevant tool to use when teaching about climate. The GIS-T Project employs GIS to bring climate education alive. ![]()
GIS-T.eu is an educational platform (in multiple languages) to support teachers and students in the use of Geographic Information Systems (GIS) within themes such as sustainability, green issues and, above all, climate change (https://gis-t.eu/).
The free MOOC "GIS for the Future" forms the heart of the site (https://gis-t.eu/gis-for-the-future/). This open access course contains database of detailed lessons that thematically address climate consequences, from heat stress and flood risks to sustainable energy and urban greening. Each lesson is supported by instructional videos and concrete GIS assignments that support teachers to teach their students how to analyse and visually represent data.
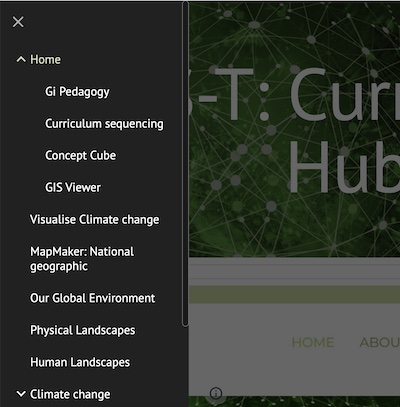 Explore the drop down menu of the GIS-T Curriculum Hub for access to the most significant tools and resources in visualising climate change, use the GIS technology and explore the impacts of climate.
With GIS-T.eu, you can bring climate education to life in the classroom: interactive, investigative and future-oriented.
Discover how you can use GIS to teach students to look critically at their environment and explore solutions for tomorrow's world.
Did you know there is a free scheme for schools and pupils to access state of the art GIS technology? Teachers and students can access ArcGIS Online, StoryMaps and Survey123
Visit https://www.esri.com/en-us/school-program-europe/overview to find out more.
How do you use GIS in your classroom?
Please log in or sign up to comment.