
Dear community,
Together with the European Atlas of the Seas, we are happy to launch the science action phase of the community challenge "Be a scientist! Mapping climate change at seas & coast"!
What?
Climate change can be traced and visualised in many ways.
The community has collectively chosen to do this with its own water surface temperature map in the European Atlas of the Seas.
This interactive map will showcase all school measurements made and make them explorable for class discussions.
This map is empty for the moment.
So now, these temperatures need to be measured and reported across the EU by the community!
Explore your surroundings, learn about data collection & treatment and become a marine geographer with us.
For whom?
- Teachers & trainers from any level – guide your pupils through measuring water temperatures and submitting data to us & delve into the many possible class activities around it.
- Students from any level – gather and measure what is going on around your school.
How?
Let’s be scientist all over Europe and map water temperatures locally to create our common school map.
Until 31/03/2023
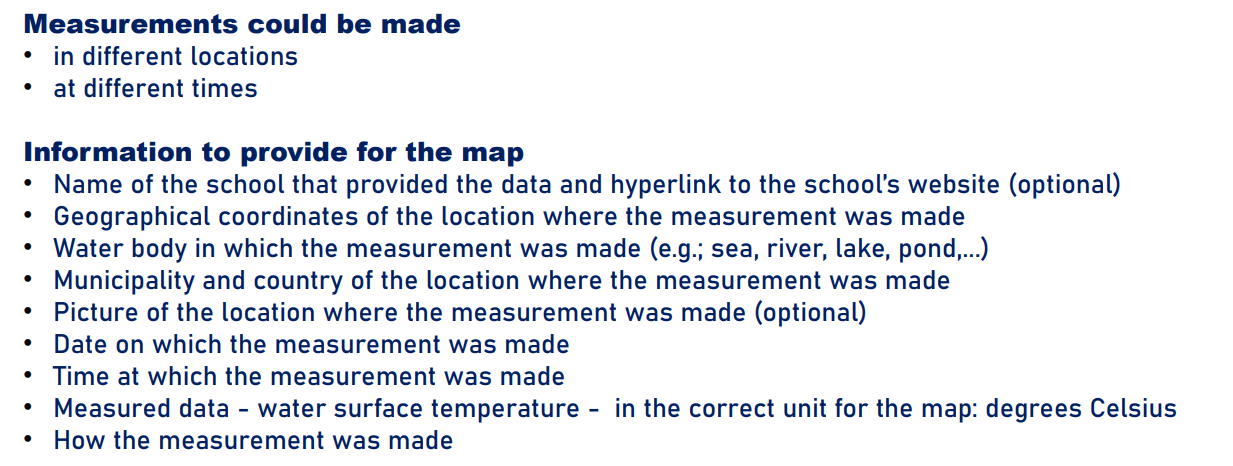
1. Measure the water surface temperature at your water body. No internet connection needed at this stage.
2. Fill in the online form: https://ee.kobotoolbox.org/x/RlixrmI2
Teachers and students can access the form on computer or mobile phone. Mandatory fields are indicated with a star. Other fields are optional. The form cannot be submitted if they are not completed.
3. Let us know in the comments below if you intend to participate! Which school activities will you run around exploring, collecting and reporting these data?
4. We are here to help you. Let us know what you would need to run this challenge. More guidelines? Time? Certificates for agreement with headmasters? A conversation with the challenge hosts?
Hello,
I'm a Biology teacher in Reunion Island (French department in Indian Ocean) and I frame the eco-delegates of my school (children of 11 to 15 years old). With our students (6th grade, 11-12 years old), we study marine Biodiversity in parallel of learning to swim. In this context and in order to follow and use the data of this map with the other grade when we'll study climate change, I would like to participate in collecting and reporting these data.
I think that we will collect the data when the student will go learning to swim with their Physical Education and Sport teacher (end of october to end of november) at Saint Pierre (in the south of our Island) and when they will participate in a scuba diving at l'Ermitage (in the west coast of our island).
I hope that we could bring our participation at this project.
Best regards
Mme MAILLOT Aurélie
collège Les tamarins
Marie.Maillot1@ac-reunion.fr
Marie Aurélie MAILLOT - welcome to the community and excited to read about your activity & data input!
Looking forward to receiving your data and learning about your work. Do not hesitate to contact us if you have any questions!
Hello! I am a teacher for primary education and my students are in the fourth grade. We live in Romania, in the city of Galati, a port on the Danube. The city is located at the confluence of the Siret and the Danube and is surrounded by waters: Lake Brateș, Lake Cătuşa, Lake Partidului. The students will go fishing with their parents and will have the task of measuring the temperature of the water they are fishing from.
Welcome to the community, Anica-Maria Tănase - happy about your participation and interested in your findings!
Looking forward to receiving your data and learning about your activities. Do not hesitate to contact us if you have any questions!
Hello! We are an etwinning group , from 5 countries, called Drop by drop with a respectively named project We are working on learning about our waters and their protection. I was wondering what kind of a thermometer should we use to measure sea temperature? (This is a sample of our collaborative work so far: )
https://read.bookcreator.com/8PHeEDpAMMZ8R9kKfcC1GnQavgk1/QaaN_3y3R8KlT…
Dear Elena, Thank you for your message and congratulations on the Drop by drop project! For the challenge, we have not specified how to measure the temperature. You can thus choose the type of thermometer you use. In the online form to upload your measurement, we ask you to briefly explain how you measured the temperature. You can also include a picture if you wish. The aim of the challenge is to help students learn about the benefits of working together as their temperature measurement(s) will be combined with measurements from other schools to create a common map. All schools will not measure the temperature with the same type of thermometer. The measurements will thus not be strictly comparable to each other but we will highlight each time how the measurement was made. The objective is also to help students learn that, when they measure the temperature, they also have to collect other information such as, for example, the method used, the location where the measurement was made and the date and the time. We look forward to your contribution to the new map! Do not hesitate to contact us if you have other questions.
Looking for background information on sea surface temperature? Have you seen the maps already available in the European Atlas of the Seas (www.european-atlas-of-the-seas.eu)?
- Open the Atlas.
- Click on the magnifying glass to start searching the Atlas.
- Type ‘temperature’ in the search window.
- The list of relevant map layers will appear.
- Click on (i) to read information about the map layers.
- Tick the box of the map layer you wish to see.
- Close the search window.
- Dive into the map!
In the future, it will also be possible to see your map in this search!
Do you need help to change the language or navigate in the map? Click on the menu (icone with 3 lines) and select ‘Do you need help?’.
Hello,
I am a science teacher from Greece. I live in Paralia Avlidas, 60 Km from Athens, capital of Greece. My home and my school are very close to the sea. My students have the possibility to get the temperature of the sea water very easily. My goal is to motivate my students to love science and to be informed about climate change. I think that this project will support my teaching method.
I would like to know if we could see on the map the measurements that have already done (The data that the students from other countries or my country have already collected)
Have a nice cooperation!
Hello, The map with schools' measurements of water temperature is not yet available in the Atlas. Data collection has recently started. We need to receive more data before the map can be created. So, we will be glad to receive data from your school and many others! When the map will be published, it will be possible for everyone to see the data from all of the schools that have participated in the map. In the meantime, you can explore other maps on water temperature that are already in the Atlas by following the steps mentioned in the message above. These maps include data from drifting buoys and satellite derived data. There is also a map showing sea surface temperature changes over the period 1993-2018. If you type 'oceanographic' in the search window, you can see all of the maps showing different types of oceanographic instruments that provide different types of measurements. By clicking on them in the maps, you can see what they are measuring, for example, water temperature and water salinity. Do not hesitate to contact me if you have any questions.
You may also be interested in information included in the 'Ocean Explainers' developed by the Copernicus Marine Service. It is available at https://marine.copernicus.eu/explainers. You will find ocean literacy resources at https://eurogoos.eu/ocean-literacy-resources/, https://oceanliteracy.unesco.org and https://webgate.ec.europa.eu/maritimeforum/sites/default/files/handbook…
All details and registration form for the Scientix conference are available at https://eu.eventscloud.com/website/9046/
Read the European Atlas of the Seas Map of the Week to learn about COP27 & Marine Protected Areas: https://webgate.ec.europa.eu/maritimeforum/en/node/7459
Thank you to the schools in Greece and Romania who are submitting regular water temperature measurements! All measurements are well received. Continue the good work!
To create a great map, we need data in all European countries. Have you not yet submitted your data? We are looking forward to receiving data from your school! Do not hesitate to contact me if you have any questions about the challenge or how to submit data!
Did you miss the European Atlas of the Seas' presentation at the Scientix conference? The presentation and the recording are now available online at https://webgate.ec.europa.eu/maritimeforum/en/node/6409. Have a look!
"What can you do with it?", you ask yourself? Here some inspiration:
By clicking show content, you agree to load the embedded content from "Twitter" and therefore its privacy policy.
By clicking show content, you agree to load the embedded content from "Twitter" and therefore its privacy policy.
You did it! Thank you and congratulation! The map on water surface temperature is now online in the Atlas in the section on Ocean Literacy! Do not hesitate to share the map and use it in multiple ways. Do you have ideas on how the map can be used in the classroom? Suggestions for map-based exercises and games? Let us know! And stay tuned for the upcoming Map of the Week based on the new map!
Please log in or sign up to comment.